Election Modelling - Part 1
It's happening! I actually wrote a blog post. But also the UK is having a general election in December, the third in the last five years. Over the next several weeks we can expect an influx of analysis, predictions and statistical models, all trying to make sense of the situation, and figure out who is likely to win. How those models will work, and the types of predictions they make is likely to be very different to what they did just two years ago during the last campaign, all thanks to an extremely successful experiment run by pollster YouGov. This series of blogs is about what they did.
Back in 2017, when the UK last had a general election, YouGov, a major polling and market research company, experimented with a new model for forecasting the election. They predicted that the most likely outcome of the vote was a hung parliament, i.e. that no political party would win a majority. It's easy to forget what a bold prediction that seemed at the time. The conventional wisdom was that Theresa May's conservative party was all but guaranteed to win, the only question was how much by.
The modelling technique YouGov used is known as multi-level regression with poststratification, or MRP for short. These types of models are hard to understand, let alone to implement, but contain a lot of extremely interesting ideas and maths in their design. In this first post of a series of three I'll talk about the UK political system and some of the drawbacks of traditional polling methods. In the next post we'll cover some technical preliminaries such as Bayesian statistics and computational inference. In the last post we'll describe how MRP itself works.
UK elections
Since we'll be looking at the particular example of the 2017 United Kingdom general election, there are a few things we should know about the UK political system. Brace yourself for a lightning tour.
The UK is divided into geographic areas known as parliamentary constituencies. Currently there are 650: 533 in England, 40 in Wales, 59 in Scotland, and 18 in Northern Ireland, though they are periodically reviewed and redrawn. On polling day, registered voters cast their vote for a candidate to represent the constinuency they are resident in. Each of the major parties typically fields a candidate in every constituency (with some exceptions). There may also be independent candidates or representatives of smaller parties running. The candidate that receives the most votes in that constituency wins a seat in the House of Commons, the elected body of government. The party with the most seats, or a coalition or parties and MPs with a majority of seats, forms a government. There is no national vote, the overall outcome of the election is decided by the outcomes in these 650 local elections.
Basic polling
To understand MRP and the problems it solves, it's useful to first understand how conventional polling methods work, and what their limitations are.
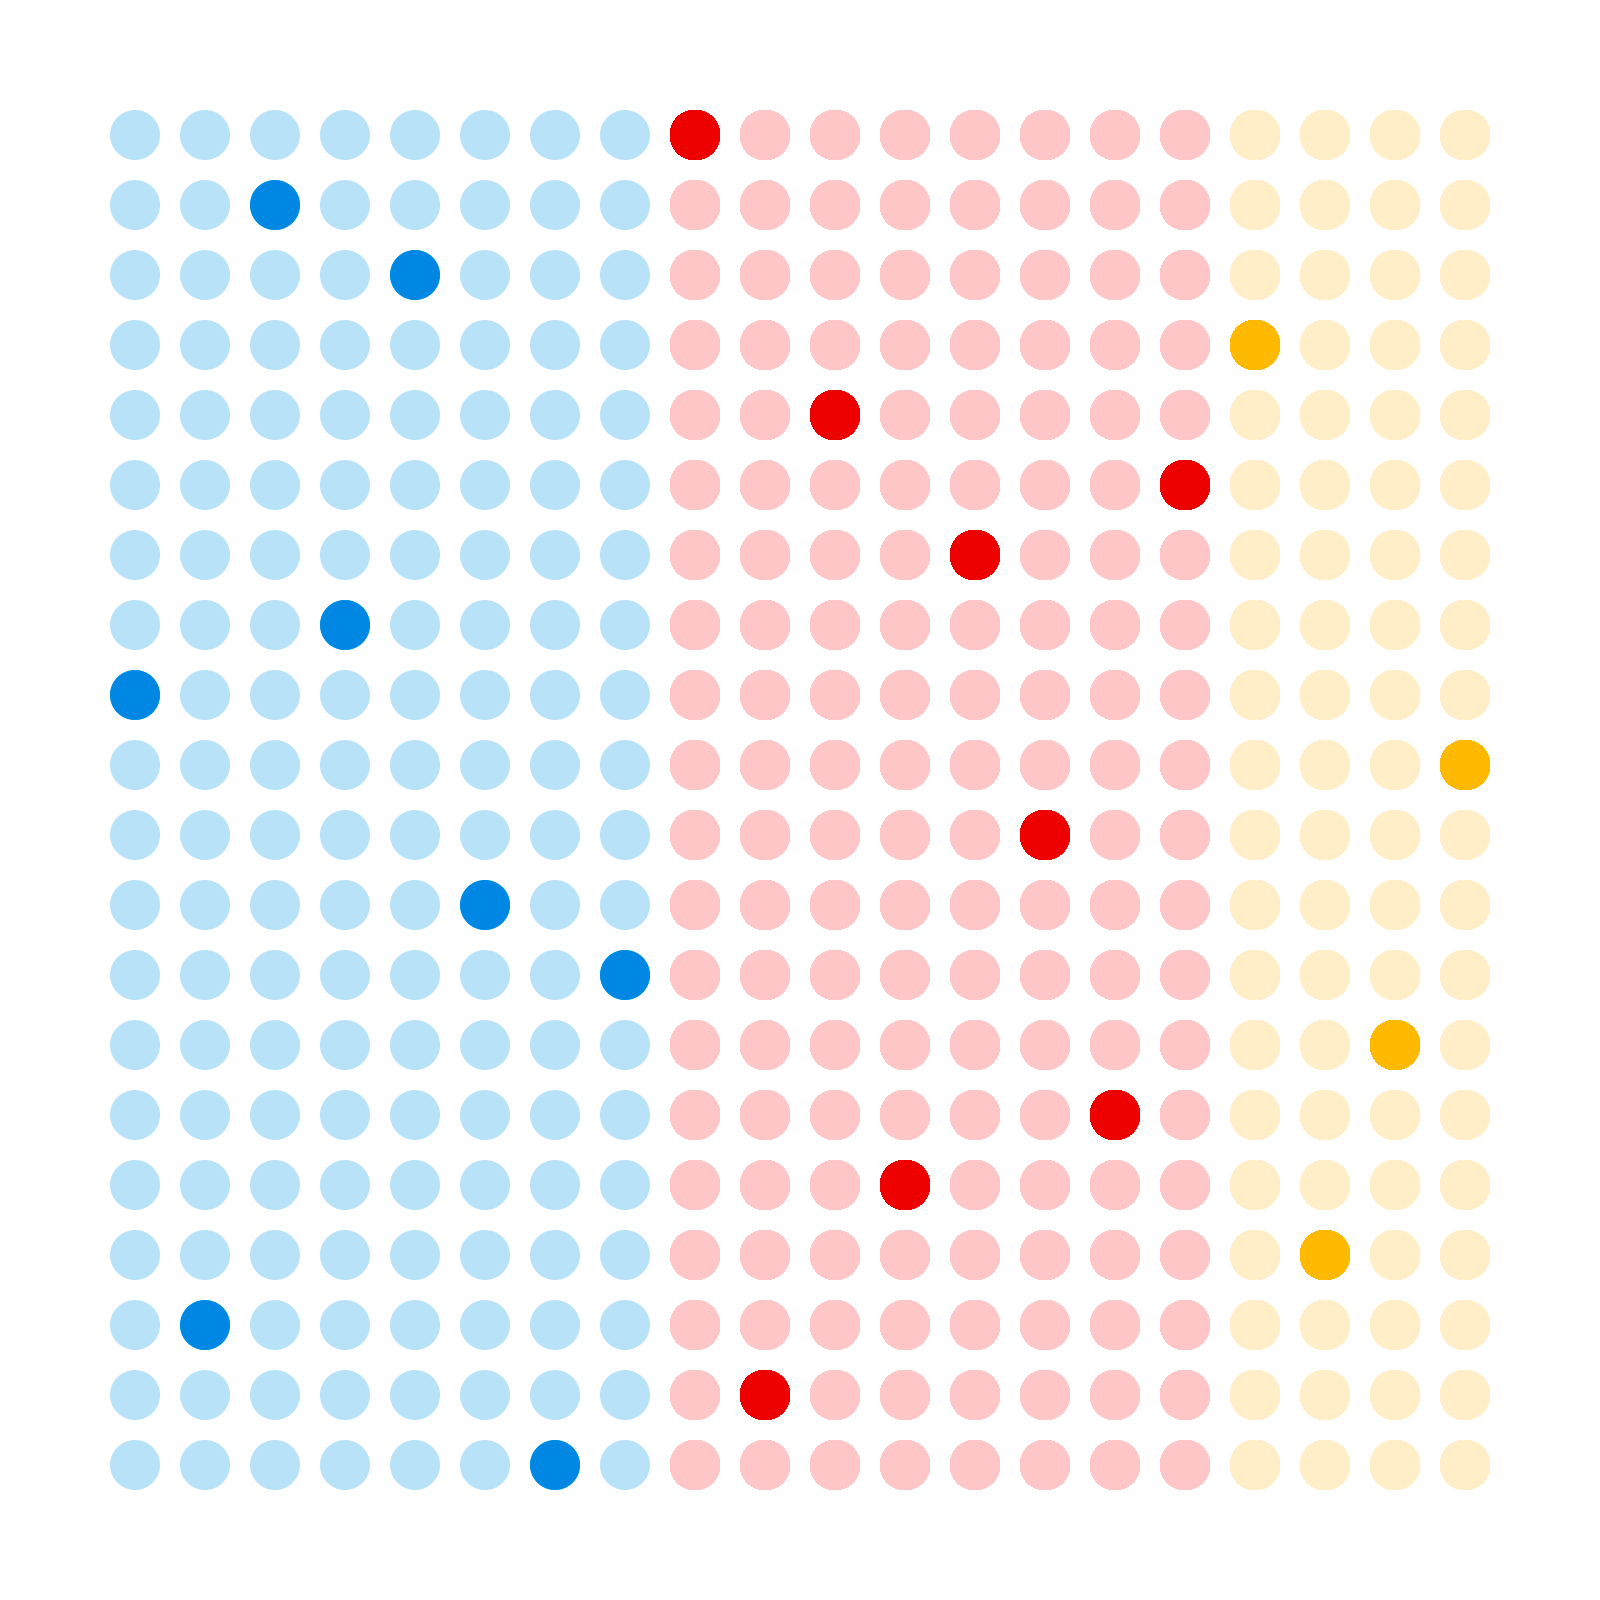
Basic polling analysis might proceed as follows. We have a population of voters, the electorate, each of whom have their personal preferences for the parties they want to vote for. We can illustrate that as follows, where colour represents political preference.

We select a random sample of the population, and ask them what their voting preference is.
We calculate the proportion of voters in the sample that intend to vote for each party, and use that as our estimate of the proportion of voters in the electorate that will vote for those parties.

We know from the Central Limit Theorem that the more people you sample, the closer the sample proportion will get to the true proportion. In fact, we can even quantify the effect of increasing the sample size. Specifically the sampling error scales like the inverse square root of the sample size, so to halve sampling error we need to quadruple the sample size. Pollsters typically balance the cost of polling lots of people against the need to reduce sampling error to an amount that doesn't diminish the utility of the polls. It turns out a poll of about 1000 people will give you error bars of about 3% either side of the estimate, which is often a resonable balance of certainty and expense.
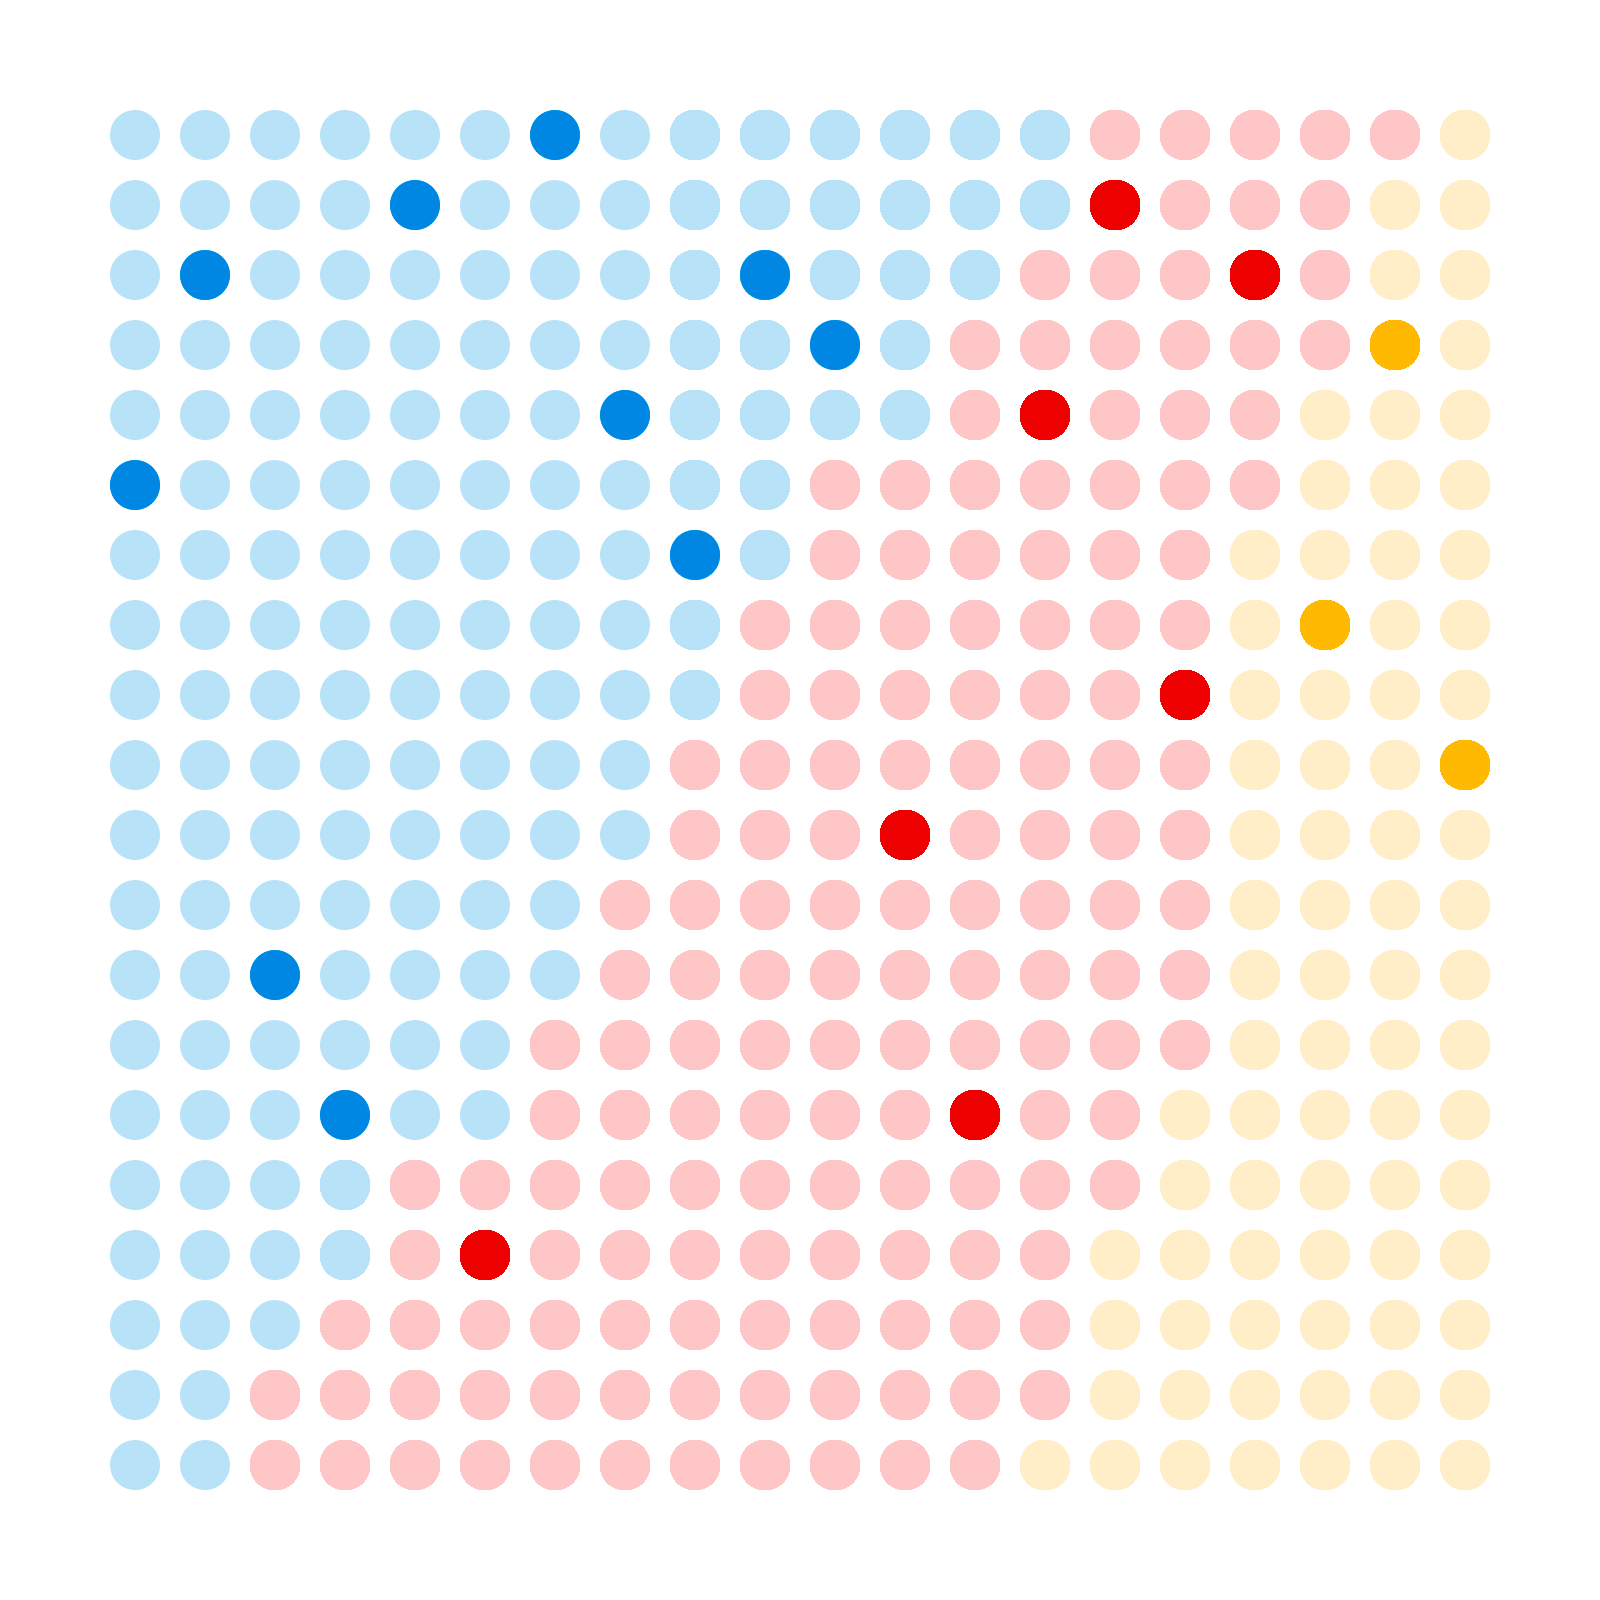
All of the above though is predicated on a pretty major assumption, which is that the only source of error in our estimates is sampling error. In practice there are many other sources of error. One example is so-called "frame error", which is error introduced to the estimates by not having a representative sample. For example, political preference is not evenly distributed across the electorate. Currently in the UK support for parties is strongly correlated with age. Perhaps that looks something like this

If the poll is more likely to reach older people, for example if we do a telephone poll and older people are more likely to have a landline, then our sample could be biased.
Which would lead to biased estimates.

Errors are not the only problem
Setting aside all of these issues, there is a bigger problem. Even if we could eliminate all errors in our estimates, we're not really answering the right question. We want to know who is likely to win the election, but what we're predicting is national vote share. What decides the outcome is the number of seats won, which is certainly correlated to national vote share, but is not the same thing. Indeed frequently when a single party wins a majority of seats, they do so with less than 50% of the votes cast, similarly smaller parties can win a significant share of the votes without winning any seats at all.
Polling companies and analysts will typically try to deal with this problem by converting a national vote share estimate to an estimate of the number of seats that a party is likely to win. One common method for doing this is the uniform swing method, which looks at the change in vote share for each party since the last election, and applies that change uniformly to the constituency level results from the last election and calculates what the implications would be. For example, if Labour were polling 5% better than at the previous election, the uniform swing method would predict that they do 5% better in every constituency. So in any constituency where they lost by 5% of the vote or less, all other things being equal, we predict that Labour wins that seat.
Such methods are relatively crude, and do not accurately capture the complex dynamics that can affect support for a party in different constituencies in very different ways. Ideally we would like to make individual forecasts in each constituency then aggregate that into a national forecast. The problem of course is that there are 650 constituencies, so to conduct a robust poll of 1000 people in every single one would require polling well over half a million people.
We are stuck between two undesirable options:
- We can pool data from all constituencies together and model them as one. This approach however fails to capture known differences in the makeup of constituencies.
- We can model each constituency separately. This approach however typcially would require more data than we can reasonably expect to be able to collect, or alternatively would be subject to errors introduced by small samples
Ideally we want to find a way that we can share information between constituencies to make up for the lack of data available in any particular constituency, while still making individual predictions in each constituency. This generic problem of how best to make use of information collected from multiple groups that are related but for which we want to make separate predications is readily solved by hierarchical models, of which multi-level regression is an example.
In the next post, we'll look at some technical preliminaries so we can start to understand how these models work.